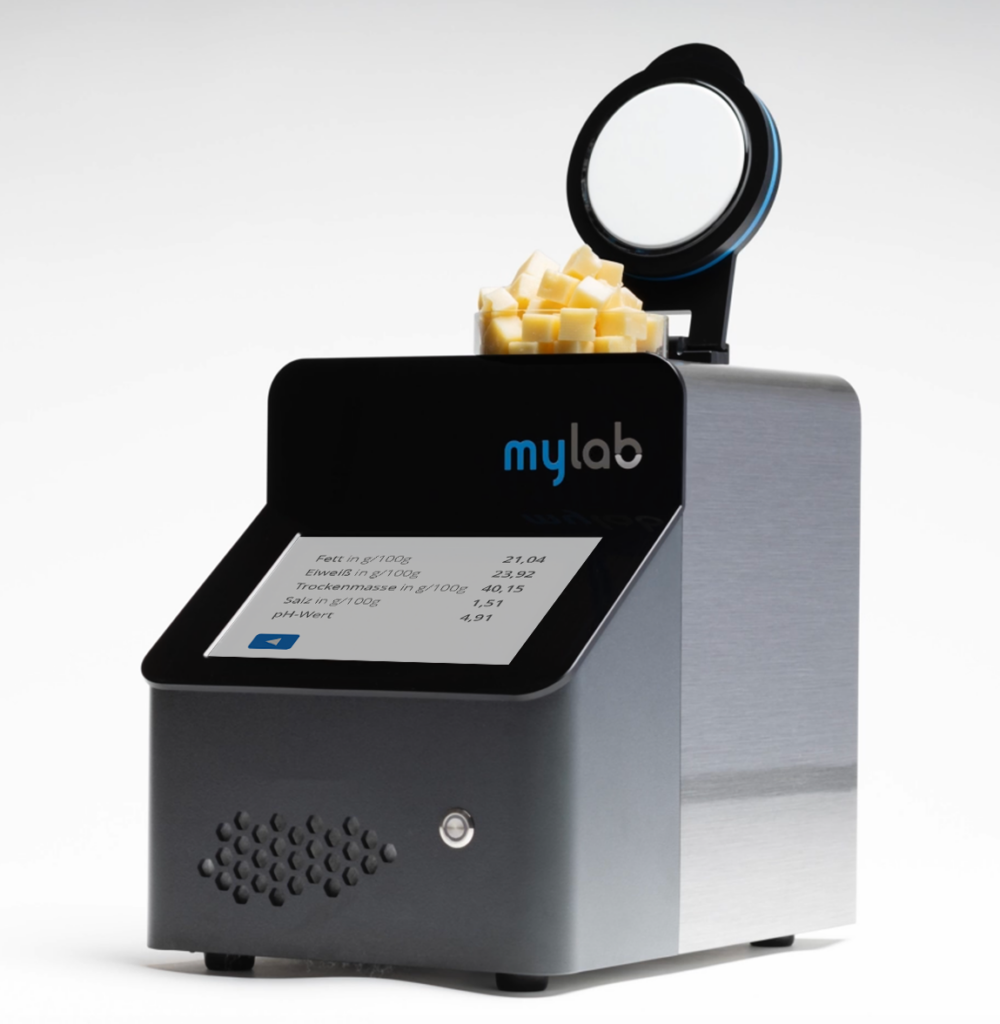
Near-infrared spectroscopy (NIRS) is a method for the rapid analysis of chemical and physical properties in solids and liquids. It is used in the food and agricultural industries, petrochemistry and medicine, among others. As a fast and cost-effective method, near-infrared spectroscopy has replaced or supplemented a large number of conventional chemical methods.
How does a NIRS analysis work?
Light in a wavelength range of 780 – 3,000 nm is defined as near-infrared (NIR). Near-infrared spectroscopy (NIRS) analyzes the interaction between the light and the sample. An NIR spectrometer records the absorption of the light absorbed by the sample at different NIR wavelengths.
NIR spectroscopy uses the characteristic absorption capacity of functional chemical groups (-CH, -OH, -NH, -SH), e.g. of water, sugars, fats or proteins. Varying concentrations of the different functional groups in a sample influence the absorption and thus lead to an individual NIR spectrum for each sample. The reflected NIR spectra are recorded by a sensitive detector and analyzed using software.
Fig.1. Exemplary NIR spectrum (950 nm – 1,690 nm) of a sample with beet molasses recorded using a mylab NIR analyzer.
Which ingredients can be analyzed with NIRS?
All components of a sample that absorb NIR light and do not fall below a certain concentration can be determined.
NIR light is used to excite vibrations in molecules (light absorption). Certain molecules absorb the near-infrared light at certain wavelengths. The substances that can be determined include water (H2O), fats and oils, sugars (mono-, poly- and oligosaccharides) and proteins. A large number of other organic substances can also be determined, provided they are present in sufficient concentration in the sample. As a “rule of thumb”, a detection limit for NIRS is a concentration of around 0.1 %. In certain cases, lower concentrations can also be reliably determined.
Application examples
Fat, proteins, lactose, solids, water and dry matter in milk and dairy products
Glucose, other carbohydrates (mannose, trealose), protein content in compressed yeast
Fat, proteins and moisture in meat, sausage, cheese and pet food
Moisture, protein and oil content in cereals
Alcohol content in beer and wine
Oxygen content in blood
What precision is achieved by NIRS analyses?
In order to be able to calculate the desired quantitative determination or the concentration of ingredients of a sample from the NIR spectra, the evaluation software must be calibrated. During calibration, NIR spectra are assigned to the values from a reference analysis (e.g. a wet chemical method). The correlation between NIR spectra and the data from the reference method is determined and used to evaluate future NIR spectra.
The result of the calibration is a mathematical equation, also known as a calibration model. Each calibration model is specific to the product and the parameters to be analyzed and must first be created for each sample type.
Fig. 2. Calibration data with a variability of < 1% from 242 NIR and reference measurements for the development of a calibration model for the evaluation software.
NIRS analyses are always calibrated using the reference methods for the desired parameters. A NIRS analysis therefore “imitates” the reference method and can therefore only be as accurate as the reference method itself.
This also means that NIR spectra take on the variability (scattering) of the reference method. As a rule of thumb, NIR-based analysis achieves approximately 1.5 times the variability of the reference method. For example, if the reference method has a variability of 0.5 %, prediction accuracies of 0.75 % can be achieved with NIRS analyses.
Product and data sheets mylab NIR Analyzer
Onepager (PDF)
mylab NIR Analyzer (en)
Onepager (PDF)
mylab NIR Analyzer (eng)
Application Note (PDF)
Calibration mylab NIR Analyzer
Contact for further information and offers
Our team of product specialists is at your disposal for questions and quotations.
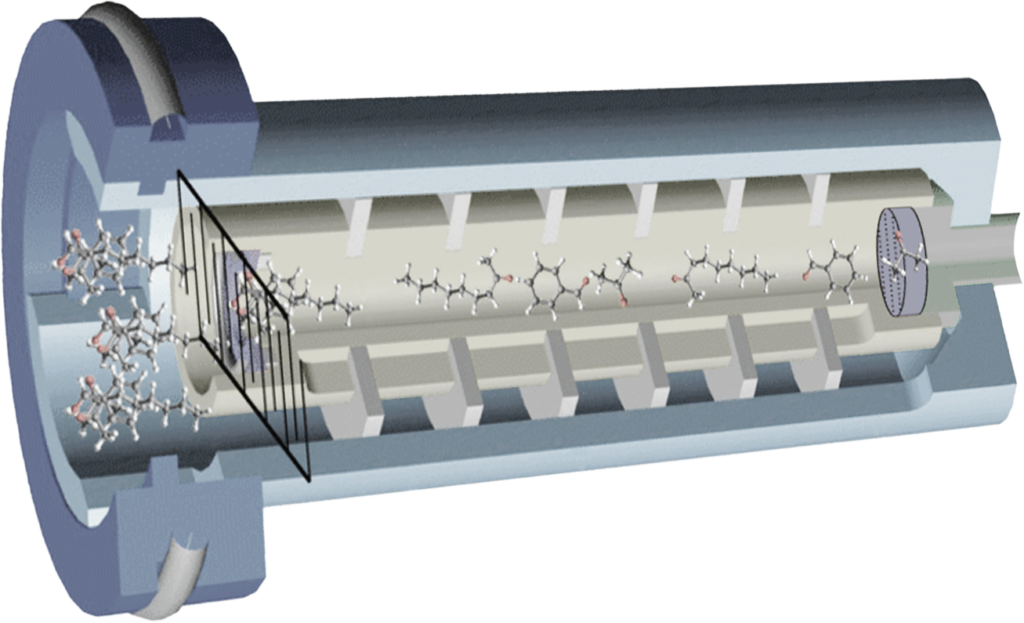
Options for automated analysis and quality control play an important role in industry. Together with you, we develop measuring stations that are integrated into the production process. We have established the methods of hyperspectral imaging (HSI) and ion mobility spectrometry (IMS) for this purpose.
Hyperspectral imaging
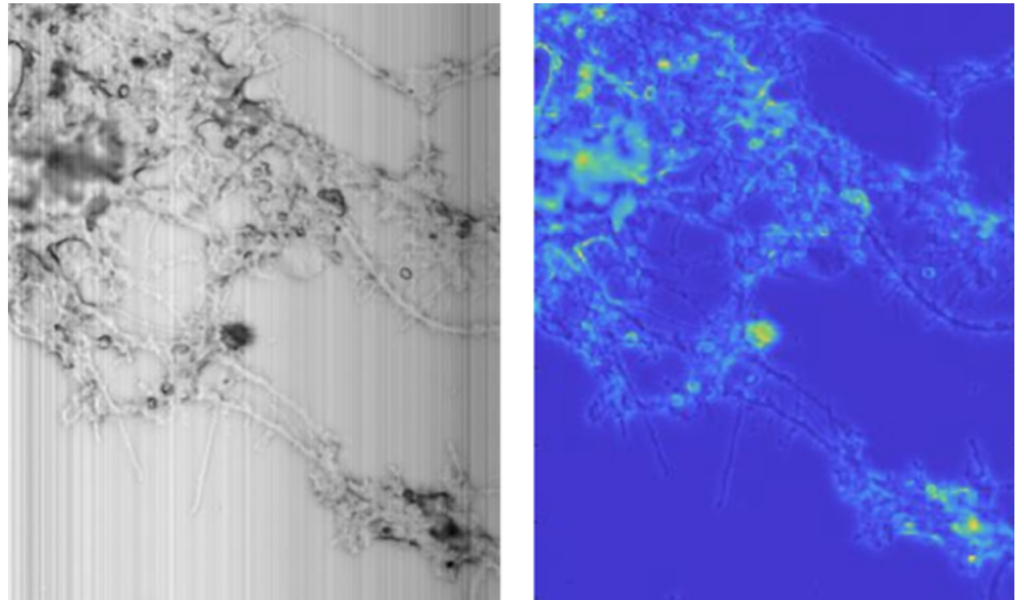
Hyperspectral imaging (HSI) is an imaging process for continuous data acquisition and evaluation in real time. HSI thus creates an excellent basis for inline controls of production flows.
An important field of application for hyperspectral imaging is, for example, quality control in food production.