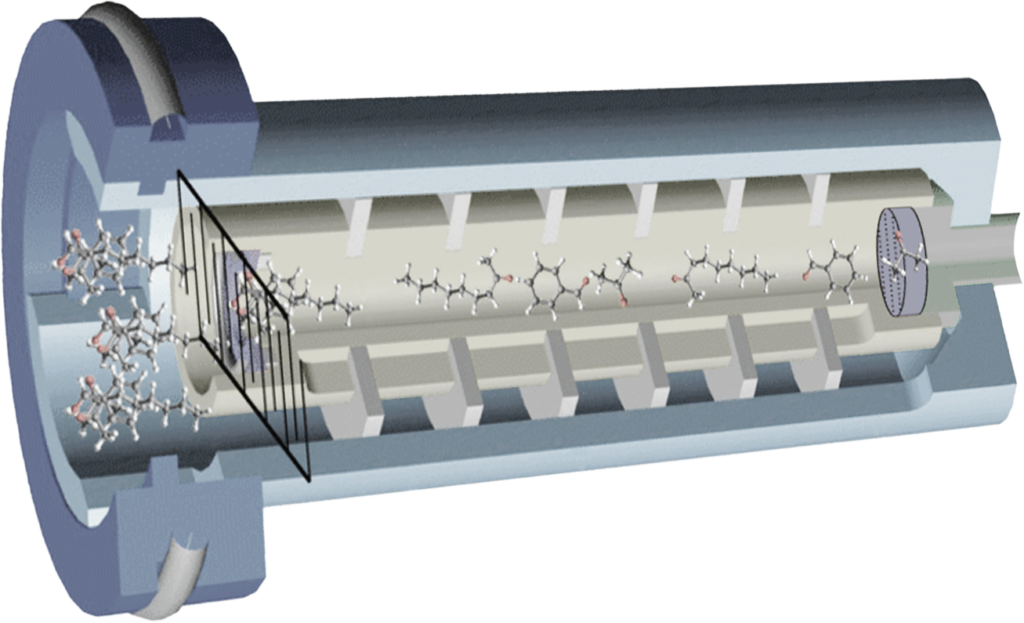
compact NIR spectrometer
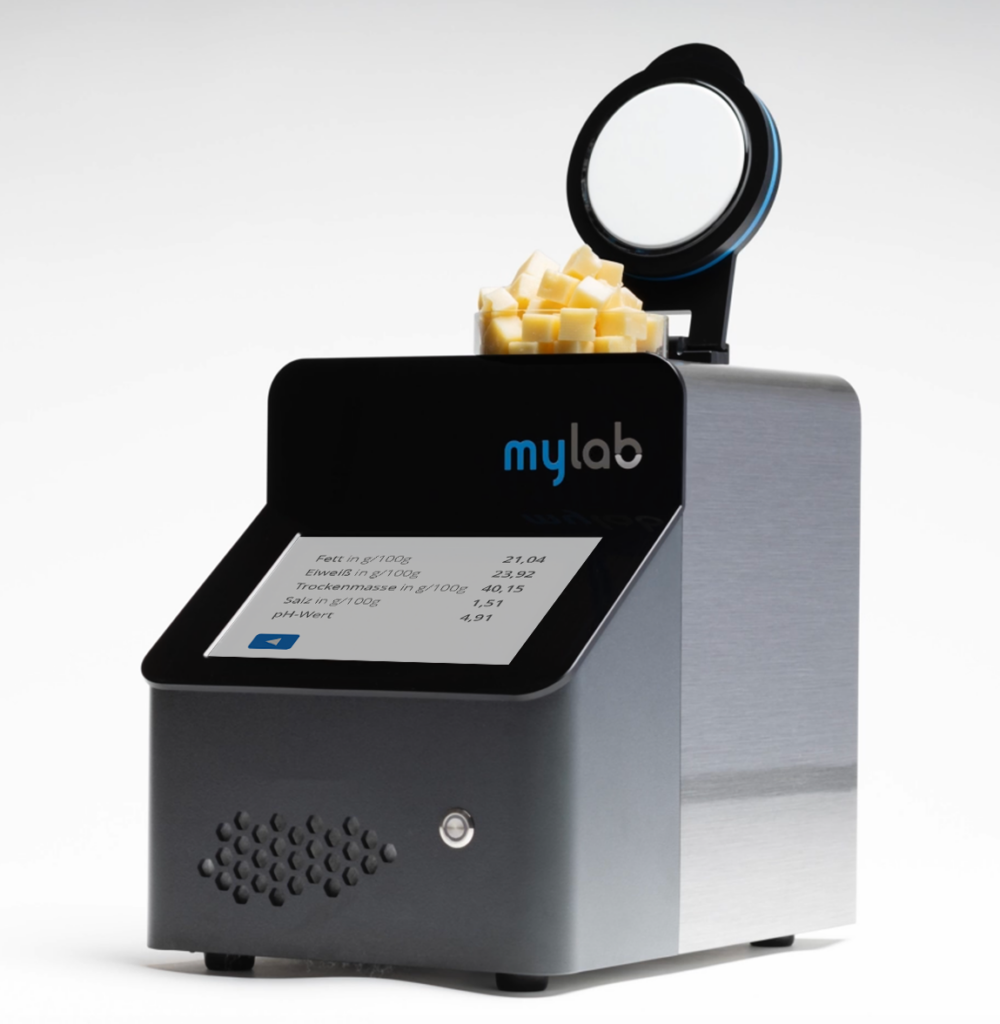
The mylab-NIR Analyzer for the rapid determination of ingredients
The mylab NIR analyzer is a compact, powerful NIR spectrometer with a very attractive price-performance ratio.
The robust NIR spectrometer is a fast and cost-effective alternative to a variety of analytical wet chemical methods. Samples are analyzed non-destructively within seconds both qualitatively and quantitatively for various parameters.
The mylab NIR Analyzer thus enables cost-effective and efficient production monitoring in many areas of the food industry, among others.
Solutions for measuring stands
Procedures for automated process controls
Options for automated analysis and quality control play an important role in industry. Together with you, we develop measuring stations that are integrated into the production process. We have established the methods of hyperspectral imaging (HSI) and ion mobility spectrometry (IMS) for this purpose.
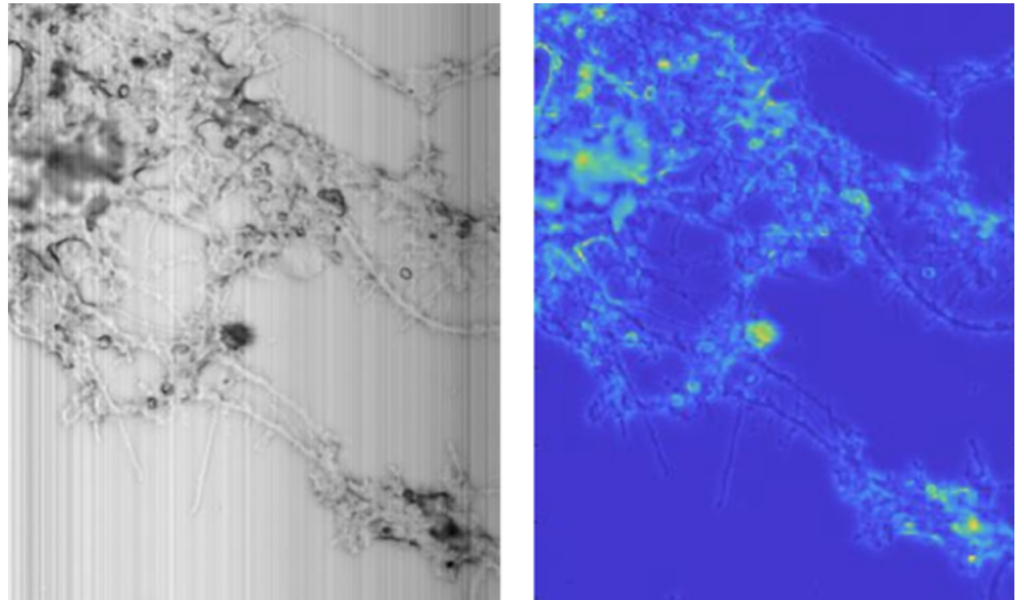
Hyperspectral imaging
Hyperspectral imaging (HSI) is an imaging process for continuous data acquisition and evaluation in real time. HSI thus creates an excellent basis for inline controls of production flows.
An important field of application for hyperspectral imaging is, for example, quality control in food production.
Ion mobility spectrometry
Rapid analysis of volatile substances: Ion mobility spectrometry (IMS) analyzes volatile compounds for their chemical composition.
IMS-based analysis is characterized by low detection limits (lower ppb range) and short measurement times (approx. 20 sec).